
Security Team Intelligence
How to ROI a Cyber Threat Exposure Management Tool with Excel Instructions
- May 31, 2023
- Michelangelo Sidagni

When evaluating any software solution for purchase, ROI is one of the most crucial parts of that evaluation. Without communicating this, you can’t prove the value of the investment. Proactive security software tools like cyber threat exposure management (CTEM) tool are no different. In fact, they are often harder to ROI given the nature of their application – being purchased to prevent something that ideally hasn’t happened yet. When it comes to cyber threat exposure management tools, it is possible to measure return on investment if you focus on the right measures of success. This requires gathering a few necessary numbers from both your internal team and the vendors you’re considering. After that, it’s just some simple math.
Before we get started, know that when it comes to ROI metrics for security products, it is impossible to determine exactly how much any security solution can save you from potential breaches. It doesn’t matter if you’re trying to assess a dollar amount or a number of thwarted attacks. There are plenty of assumptions out there in terms of the average cost of a security breach, but they aren’t something to constantly hang your hat on. Every cyberattack is unique and thus the consequences of that attack will be unique. Keep this in mind as you have your ROI conversations with internal stakeholders. It is not uncommon for C-suites unfamiliar with this reality to try to determine ROI by using figures along these lines. If you absolutely need a figure to present we recommend this stat: Average cost of a data breach – $4.24m (source: IBM Cost of a Data Breach Report, 2021).
Security teams often find it challenging to present the ROI of security investments in a format that C-Suites will understand, aka dollars and cents. Many try to use figures like MTTR and efficiency metrics (hours and vulnerability counts), but they don’t always resonate. This doesn’t mean such metrics shouldn’t be part of your ROI pitch though. They just can’t be the entire pitch.
To bridge the gap, we have to convert security KPIs into dollar amounts. This will get stakeholders on the same page. What we are going to define in this exercise is the cost savings per vulnerability remediated and the dollar value of time saved by VM employees in a language C-Suites speak. Let’s get started!
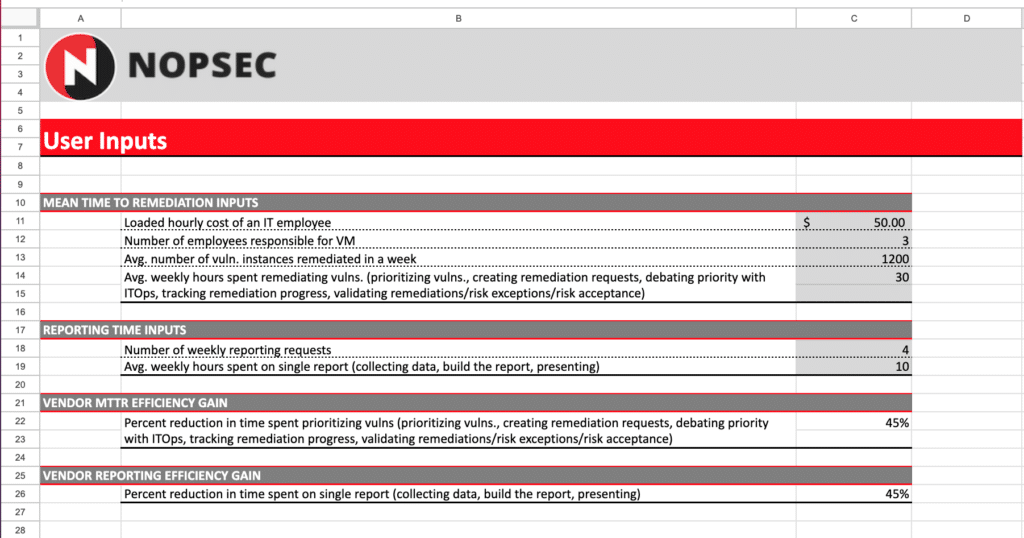
First things first. You’ll need to collect the following figures from your team:
One important note to be clear on. When we say the number of vulnerability instances remediated in a week, we aren’t talking about the number of unique vulnerabilities. You could have three unique vulnerabilities and ten instances of each of them combining for a total of thirty vulnerability instances. Thirty is the number you want to use in this calculation.
The figures you’ll need from your CTEM platform vendor shortlist are as follows:
Percentages work best for these numbers.
Next up, pull up an Excel spreadsheet.
We’ll be completing this exercise in one tab. In doing so you’ll be creating two different tables. For the sake of having a one-to-one comparison between my instructions and what you’re about to create, especially when we get into the specific formulas you’ll use in the second table, I highly recommend that you match the structure I layout exactly as is in the screenshots below. If you do, things will translate perfectly.
Onto the first table. Replicate the first table shown in the screenshot below. This first table simply lays out the inputs you’ve collected. Once built, go ahead and add the data you collected about your organization and from your vendors to the corresponding cells in this table. There are no formulas in this table.
Quick side note. In the ROI assessment we do for our prospects, we include an additional level of detail that is not included in this post. In our assessment, we can show you a before and after of your risk profile and the change in your overall risk grade when you implement NopSec. These calculations are specific to using the NopSec platform and our prioritization algorithm. To keep this post universally applicable we opted to exclude this. If you’d like to get this before-and-after risk snapshot, you can fill out our cyber threat exposure management tool tool ROI assessment form. If you do, we’ll calculate everything we’re covering in this post and this additional measure of ROI.
Let’s move on to our calculations table!
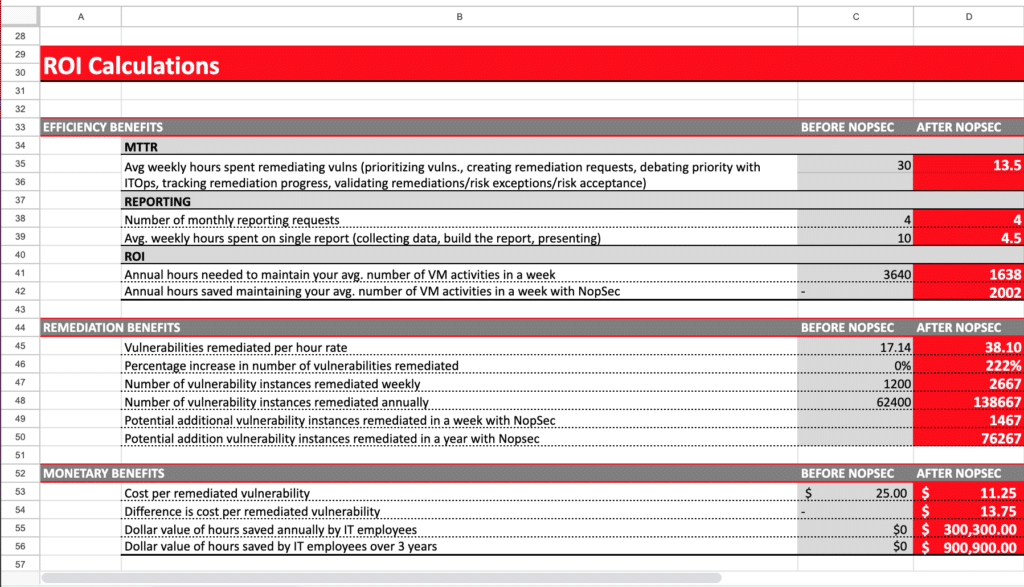
Below is the screenshot to use to create and structure the second table. This table will eventually compare the before and after effects of implementing a CTEM platform for your team. Friendly reminder again, keep the same cell layout when building this table. This will make the final step substantially easier and quicker.
Last step. Let’s add the formulas to complete this ROI spreadsheet. To do so, simply go to each cell in the spreadsheet listed under the “Cell ID” column in the table below and input the corresponding formula from the adjacent “Cell Formulas” column. If you didn’t match the exact layout detailed in the screenshots above, these formulas and the cells they reference will likely be different and broken.
| Cell ID | Cell Formula |
| C35 | =C14 |
| D35 | =C35*C22 |
| C38 | =C18 |
| D38 | =C38 |
| C39 | =C19 |
| D39 | =C39*C26 |
| C41 | =SUM((C39*C38),C35)*52 |
| D41 | =SUM((D39*D38),D35)*52 |
| C42 | Leave Blank |
| D42 | =C41-D41 |
| C45 | =(C13*52)/C41 |
| D45 | =(C13*52)/D41 |
| C46 | 0% |
| D46 | =((D45+C45)-C45)/C45 |
| C47 | =C13 |
| D47 | =D48/52 |
| C48 | =C47*52 |
| D48 | =(C47*52)*D46 |
| C49 | Leave Blank |
| D49 | =D47-C47 |
| C50 | Leave Blank |
| D50 | =D48-C48 |
| C53 | =(C11*C12)/(C13/5/40) |
| D53 | =(C11*C12)/(D47/5/40) |
| C54 | Leave Blank |
| D54 | =C53-D53 |
| C55 | $0 |
| D55 | =(D42*C11*C12) |
| C56 | $0 |
| D56 | =D55*3 |
Once you’ve got all of these formulas in place you’re done! Now you have a complete narrative to tell any stakeholder, regardless of their technical proficiency, about how a CTEM platform can provide ROI. Let’s quickly walk through this narrative so you can articulate these figures to your stakeholders.
The first before-and-after comparison breaks down the efficiency benefits you gain from the implementation of a cyber threat exposure management tool. To put it simply, because of the CTEM platform, your Vulnerability Management team will save this amount of hours over the course of a year. What happens with that time saved and the value it adds is what comes next.
The second set of before-and-after comparison figures takes the hours you saved in the previous section and translates those hours into additional remediation output for your team. AKA, an additional reduction in your risk exposure. These are quantified by the number of additional vulnerability instances that get remediated. These figures will likely be understood at a basic level by non-security practitioners – the more vulnerabilities remediated the less risk there is. Make sure to not entertain the “how many breaches does this mean we’ll avoid?” trap that can come up with these numbers.
Finally, the last set of comparison figures gives you two options to display bottom-line impact. Option one- if you repurpose the hours saved from the first section of this table into additional remediation output you can show a drop in the cost per vulnerability remediated. Paired with the total number of additional vulnerability instances remediated, this is a powerful story. Option two- if you don’t repurpose the hours saved from the first section and want to maintain the current team output, you can see cost savings of all the hours no longer needed to perform the same level of remediation. There you go, the narrative is complete!
As mentioned above, if you’d like to save yourself the time of building another spreadsheet, fill out our cyber threat exposure management tool ROI assessment form and we’d be happy to do this exercise for you. We can also show you how your risk profile will be adjusted and reprioritized if we complete the ROI assessment for you.
The Problem with Vulnerability Assessment Scanners If you’re reading this post, chances are you’re looking to take the next step…
Cyber threat exposure management (CTEM) tools are a new technology replacing traditional vulnerability prioritization tools (VPT). They were created to…
So, you’re looking to take your vulnerability management game to the next level with a vulnerability prioritization tool (VPT). Well,…